
How Often Products Go Out of Stock at U.S. Retailers
StoreLocators’ study of how often products go out of stock at U.S. retail stores, how long they stay out and whether a nearby store has them. Every number comes from availability as reported by retailers’ own websites for specific stores, for products from 98 consumer brands that use StoreLocators.
2,833
products
98
brands
103,131
stores
66
retail chains
Availability as reported by each retailer’s website for a specific store, recorded daily at most chains, June 21 to September 18, 2026.

3.4%
3.4% of products in stock at a U.S. retail store on a given day are reported unavailable at that store 7 days later
95% range 3.0–3.9% · n = 175,728,302 product-store days across 96 brands.
Retailers whose website reports store stock rather than pickup eligibility: 3.4%. Median brand: 3.2%.
How often do products go out of stock?
Of products reported in stock at a store today, 0.8% are reported unavailable the next day, 3.4% a week later and 6.3% thirty days later.
n = 175,728,302 product-store days across 96 brands. In-stock product-store days observed again on the later day.
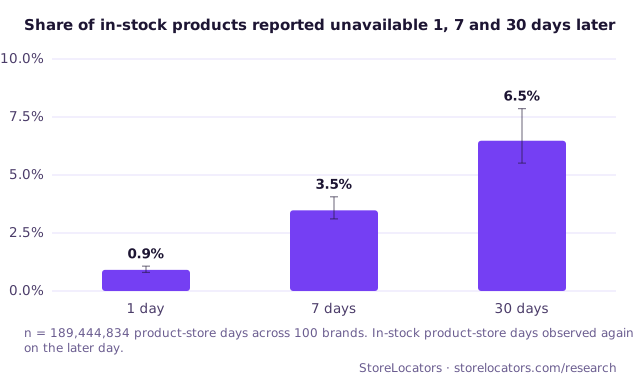
The 30-day share leaves out chains where an item long out of stock gets fewer readings, because the share there would be understated.
If a store is out, does a nearby store have it?
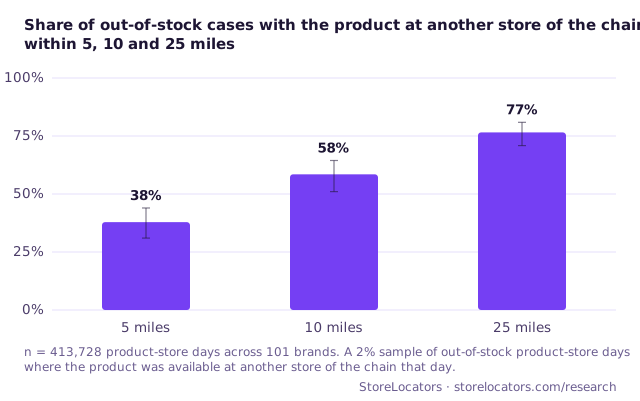
When a store is out of a product that another store of the same chain has that day, the nearest one with it is within 5 miles 41% of the time, within 10 miles 62% and within 25 miles 79%.
n = 355,689 product-store days across 96 brands. A 2% sample of out-of-stock product-store days where the product was available at another store of the chain that day.
Do a few products and stores account for most out-of-stocks?
Within a chain, the 10% of a brand's products with the most out-of-stock days account for 36% of them, and the 10% of stores with the most account for 28%.
n = 37 brand-and-chain combinations across 16 brands. Median across brand-and-chain combinations with at least 20 products and 1,000 out-of-stock product-store days; the stores figure is the median of 189 combinations from 83 brands with at least 20 stores.
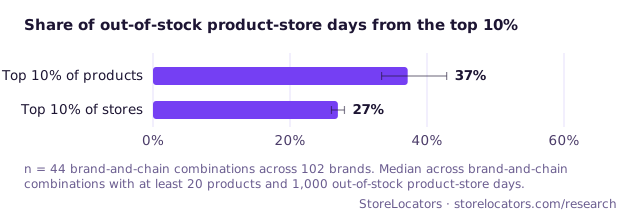
Chains where an item long out of stock gets fewer readings are left out, because they undercount out-of-stock days.
How long do products stay out of stock?
Once a product is reported out at a store, 17% are reported back within a day, 55% within a week and 83% within 30 days; 17% were still out after 30 days.
6 days
typical time out of stock (median)
95% range 5–8 days
n = 1,467,928 out-of-stock spells across 94 brands. Each share counts only spells that had that many days to come back.
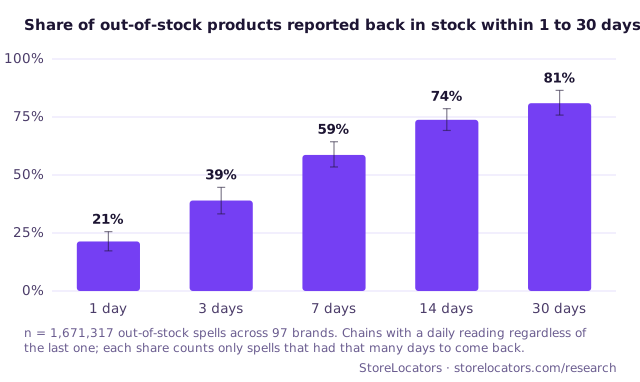
The 30-day shares leave out chains where an item long out of stock gets fewer readings, because returns there are seen late.
Out-of-stock rates by product category
Across 7 categories, the share reported unavailable a week later ranges from 2.2% to 6.1%.
n = 125,738,873 product-store days across 66 brands. 7 categories with at least 5 brands each.
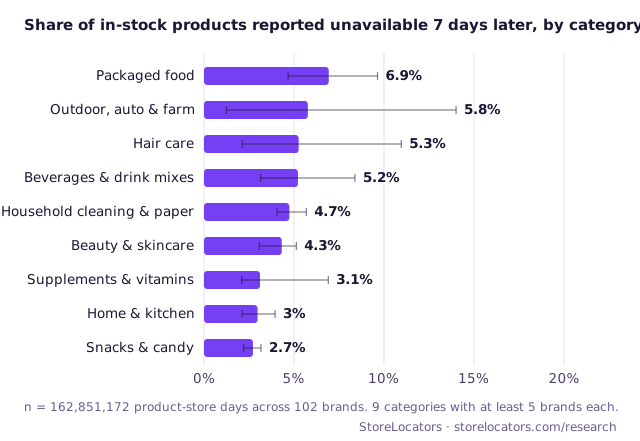
Each category below has at least 5 brands, so no single brand can be picked out.
Packaged food
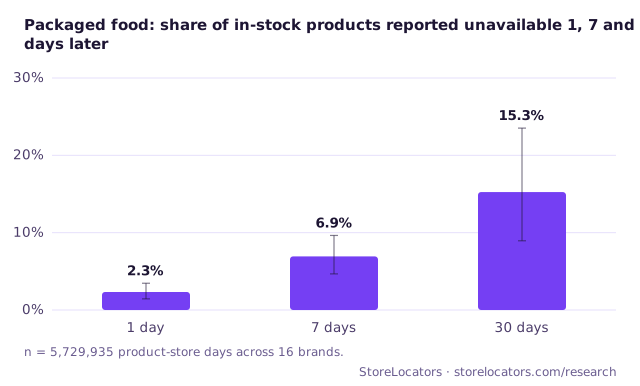
6.1% of packaged food products in stock at a store are reported unavailable there 7 days later (95% range 3.8–8.1%), over 4,760,275 product-store days from 16 brands.
65%
of out-of-stock cases had it at another store within 10 miles
95% range 58–74%
61%
of out-of-stock products back within 7 days
95% range 47–75%
72,882 spells
n = 4,760,275 product-store days across 16 brands. 95,126 product-store pairs.
Beauty & skincare
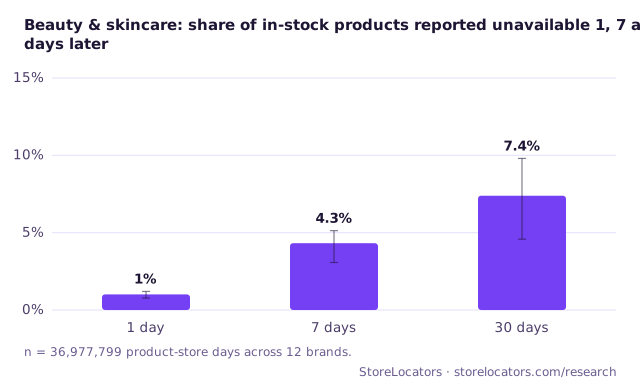
4.5% of beauty & skincare products in stock at a store are reported unavailable there 7 days later (95% range 3.1–5.5%), over 33,873,706 product-store days from 12 brands.
68%
of out-of-stock cases had it at another store within 10 miles
95% range 58–78%
48%
of out-of-stock products back within 7 days
95% range 41–58%
315,806 spells
n = 33,873,706 product-store days across 12 brands. 588,563 product-store pairs.
Supplements & vitamins
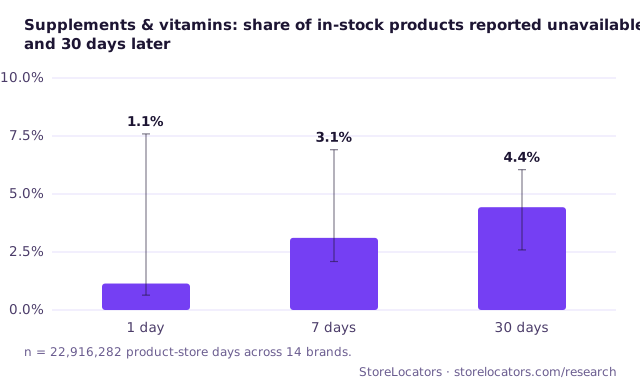
2.6% of supplements & vitamins products in stock at a store are reported unavailable there 7 days later (95% range 1.7–3.5%), over 19,669,392 product-store days from 11 brands.
61%
of out-of-stock cases had it at another store within 10 miles
95% range 51–69%
45%
of out-of-stock products back within 7 days
95% range 35–58%
105,352 spells
n = 19,669,392 product-store days across 11 brands. 306,525 product-store pairs.
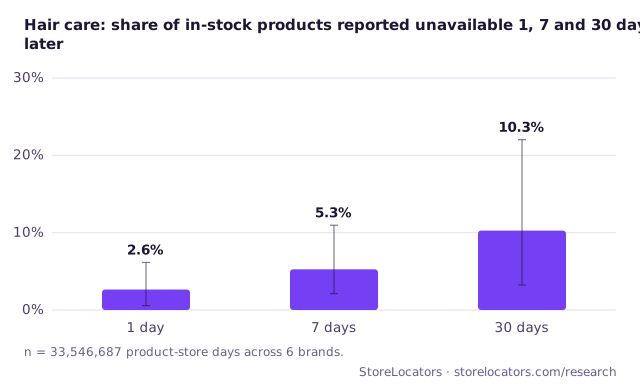
Hair care
2.3% of hair care products in stock at a store are reported unavailable there 7 days later (95% range 1.3–2.9%), over 32,308,371 product-store days from 5 brands.
66%
of out-of-stock cases had it at another store within 10 miles
95% range 57–76%
56%
of out-of-stock products back within 7 days
95% range 46–74%
210,207 spells
n = 32,308,371 product-store days across 5 brands. 577,440 product-store pairs.
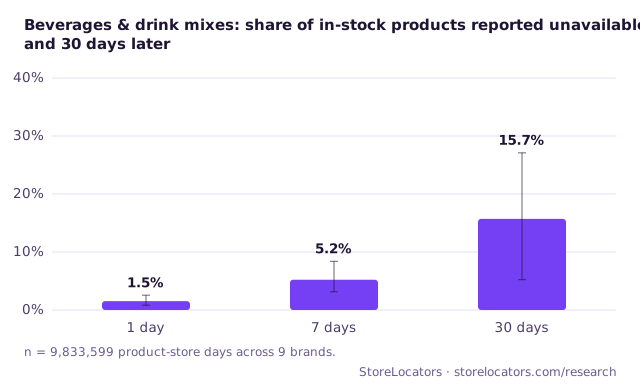
Beverages & drink mixes
3.8% of beverages & drink mixes products in stock at a store are reported unavailable there 7 days later (95% range 2.7–4.9%), over 8,951,105 product-store days from 9 brands.
56%
of out-of-stock cases had it at another store within 10 miles
95% range 45–67%
49%
of out-of-stock products back within 7 days
95% range 38–61%
60,682 spells
n = 8,951,105 product-store days across 9 brands. 154,792 product-store pairs.
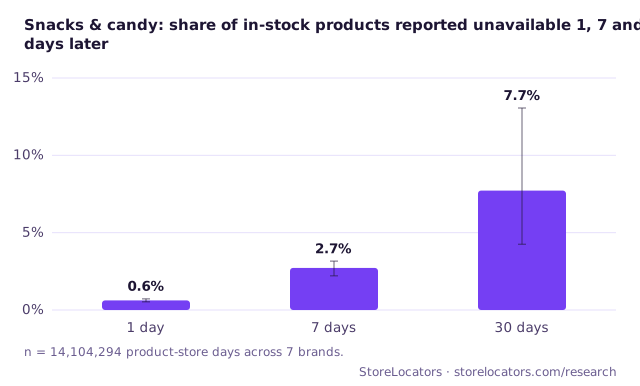
Snacks & candy
2.7% of snacks & candy products in stock at a store are reported unavailable there 7 days later (95% range 2.3–3.2%), over 13,682,645 product-store days from 7 brands.
64%
of out-of-stock cases had it at another store within 10 miles
95% range 46–79%
56%
of out-of-stock products back within 7 days
95% range 54–60%
83,207 spells
n = 13,682,645 product-store days across 7 brands. 205,200 product-store pairs.
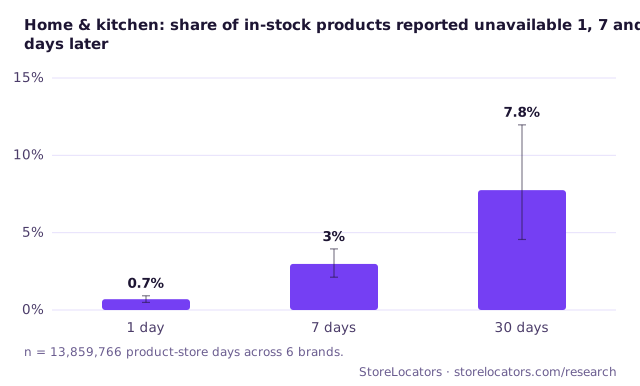
Home & kitchen
3% of home & kitchen products in stock at a store are reported unavailable there 7 days later (95% range 2.2–4.1%), over 12,493,379 product-store days from 6 brands.
27%
of out-of-stock cases had it at another store within 10 miles
95% range 12–41%
49%
of out-of-stock products back within 7 days
95% range 32–68%
66,811 spells
n = 12,493,379 product-store days across 6 brands. 190,132 product-store pairs.
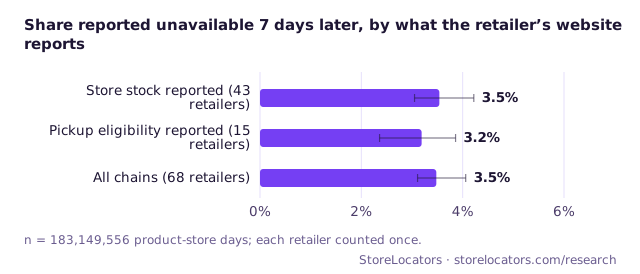
Store-stock feeds and pickup feeds
Retailers differ in what their website reports. A store-stock feed says whether the product is in stock at that store. A pickup feed says whether the product can be ordered for pickup there, which follows the store's stock but is not the same reading. Both are pooled in the headline; this chart separates them. Retailers are grouped, never ranked.
n = 169,433,024 product-store days; each retailer counted once.
Retailers in the study
The headline pools 66 chains, grouped below by what each retailer’s website reports. 18 more, whose website shows an Instacart catalog, are labelled and kept out of the headline. Walmart is kept out too, because an item reported out of stock there gets a new reading only every few days. Retailers are listed alphabetically and never ranked; the ones with a page of their own are linked.
Website reports store stock
- 7-Eleven
- Academy Sports + Outdoors
- Ace Hardware
- Alumni Hall
- Anthropologie
- AT&T
- Atwoods
- Bass Pro Shops
- BevMo!
- BJ's Wholesale Club
- Blain's Farm & Fleet
- Bloomingdale's
- Bomgaars
- C-A-L Ranch
- Coastal Farm & Ranch
- Costco
- CVS
- Dick's Sporting Goods
- Dollar General
- Erewhon
- Five Below
- Giant Eagle
- H-E-B
- Lowe's
- Mathis Home
- Murdoch's
- Petco
- PetSmart
- pOpshelf
- Runnings
- Rural King
- Sally Beauty
- Sam's Club
- Scheels
- Sephora
- Spec's
- T-Mobile
- Target
- The Paper Store
- The Vitamin Shoppe
- Theisen's
- Total Wine & More
- Tractor Supply Co.
- Ulta Beauty
- Verizon
- Walgreens
- Wegmans
- World Market
- Zumiez
Website reports pickup eligibility
- Crate & Barrel
- Fleet Farm
- Home Depot
- Kohl's
- Kroger
- Lunds & Byerlys
- Macy's
- Nordstrom
- Rally House
- REI
- ShopRite
- Sur La Table
- The Container Store
- Williams Sonoma
Website combines store stock and pickup eligibility
- Albertsons
- Best Buy
- Casey's
Instacart catalog, labelled and kept out of the headline
- Cash Wise
- Coborn's Marketplace
- Cub
- Earth Fare
- Fareway
- Gelson's
- Harmons
- Lazy Acres Market
- Metropolitan Market
- Mother's Market
- Natural Grocers
- New Leaf Community Markets
- New Seasons Market
- Publix
- Rosauers
- Sprouts Farmers Market
- The Fresh Market
- Woodman's
New reading only every few days once out of stock, kept out of the headline
Retailer pages
Each retailer page answers one question, when products that go out of stock come back, for that retailer alone. There is no ranking of retailers here or anywhere on this site.
How this was measured
One reading is what a retailer's website reported for one product at one specific store on one day: available or not. Days are counted in the store's own time zone, and only days with a reading count. A product at a store enters the numbers only if it was reported available there at least once in the previous 60 days, so products a store never carried are left out.
A restock is the first day an item is reported back after a run of unavailable days, counted only when the item had been available before, had been in the data for more than 14 days, and its listing was not edited during the run.
Every number is computed per brand and retailer first, then combined, with no brand contributing more than 10% of the pooled total, or an equal share when fewer than ten brands contribute. Each carries a 95% range and its denominator. The full methodology defines every term and lists every filter.
Validation
Every headline number was recomputed on a stricter subset: brands with more than six months of history, compared with all brands at the same 42 chains, so the comparison measures history length rather than chain mix. 58 brands over 96,301,701 product-store days. Every number is shown with the subset beside it, and the table marks any pair that differs by more than 5 points.
| Number | Full sample | Subset | Difference | Within 5 points |
|---|---|---|---|---|
| Reported unavailable 7 days later | 3.3% | 3% | 0.3 pts | Yes |
| Available within 10 miles | 57% | 50% | 7.2 pts | No |
| Back within 7 days | 60% | 55% | 4.7 pts | Yes |
Limitations
- These are retailer-reported availability readings, not shelf audits. A retailer's website can say a store has an item that is on a back-room cart, or lack one that is on the shelf.
- The sample is the brands that use StoreLocators and the retailers that carry them. It is not a representative sample of all retail.
- Some retailers report pickup eligibility rather than store stock. Those are included in the pooled numbers and separated where the page says so.
- No revenue or lost-sales figures are estimated or implied.
- Walmart is kept out of every pooled figure: an item already reported out of stock there gets a new reading only every few days, which hides short out-of-stocks and nearby stores that have the item that day. Its own page reports what can be measured there.
Downloads
The table behind every chart, as CSV. Licensed CC BY 4.0: use it freely with attribution to StoreLocators and a link to this page.
- Transitions from in stock2 KB
Share reported unavailable 1, 7 and 30 days after an in-stock reading, by chain type and category.
- Nearby availability1 KB
Share of out-of-stock product-store days with the product available at another store of the chain within 5, 10 and 25 miles.
- Concentration1 KB
Share of out-of-stock product-store days from the top 10% of products and stores.
- Recovery1 KB
Share of out-of-stock spells reported back within 1, 3, 7, 14 and 30 days.
- By category4 KB
Findings 1, 2 and 4 by product category.
More on the data page.
Change log
- 2026-09-29Corrected release. Tightened which chains and products count toward each figure, and updated the figures to match.
- 2026-09-22First release.
Release 2026-09. Data through September 18, 2026; published September 22, 2026.
About this data
This data comes from the StoreLocators store locator, which shows shoppers where a brand's products are available at retail stores near them. Brands are never named without written permission.